Jean-Francois Colonna - Mathematics and Physics
Pictures of Physics
For two thousand years and more from the seventeenth century with Galileo, Mathematics is seen as the language with which are written the laws of Nature. They are then, next to the microscope and the telescope, a revolutionary “instrument of observation” that reveals every day new and mysterious aspects of our Universe. These successes only make more mysterious their deep nature and the cause of their “extremely effectiveness” (Eugene Wigner). A possible explanation could be that Mathematics is independent of us, that they exist outside our space-time and that our reality is “just” a mathematical structure (among countless others…) inside which emerged autonomous self-conscious sub-structures (we!).
To make progress in our knowledge of the Universe, we must do Mathematics: juggling with formulas, solving equations,… All this is generally abstract, but nothing forbids us to use the sense that evolution has given us and particularly the vision; our eyes are made to be surprised, and today the computer allows us a new experimental approach: the virtuality. A so-called virtual experiment will consist of the in silico study of a model of a certain system (elementary particle to the Universe through the car…). After very heavy computations, raw results are mountains of numerical values that are a priori useless without further processing, a “staging”.
The translation from numbers to pictures is far to be a childish coloring. As a matter of fact, many characteristics of the mathematical “objects” that are manipulated will gang up to prevent any simple and objective representation. Thus, they often have no natural images (properly stupid questions then arise and, for example: what is the color of the numbers?), the spaces they inhabit are generally (much…) more than bidimensional, the time (in the sense of dynamics) is intimately related to space, etc… Experience in this area shows that it is very easy to hide what is present and to exhibit what is not, voluntarily or involuntarily…
But Mathematics is also a tool for artistic creation. The concept of potential work of art emerges: the work of art is no longer an image or a sound, but simply the underlying mathematical model. We can be assured that we are not at the end of the road of discoveries, as was the case in past years with the fractal geometry of Benoît Mandelbrot… So what scientific and artistic surprises await us, which will open new horizons to us?

Space-time at Planck scale
The super-string theory adds 7 extra spatial dimensions to our familiar 4-dimensional space-time. These 7 dimensions could be very very small (Planck length) and be defined as Calabi-Yau manifolds.
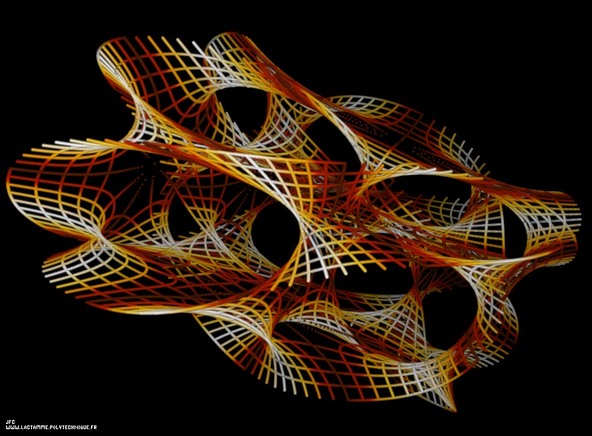
Calabi-Yau manifold
The super-string theory adds 7 extra spatial dimensions to our familiar 4-dimensional space-time. These 7 dimensions could be very very small (Planck length) and be defined as Calabi-Yau manifolds.
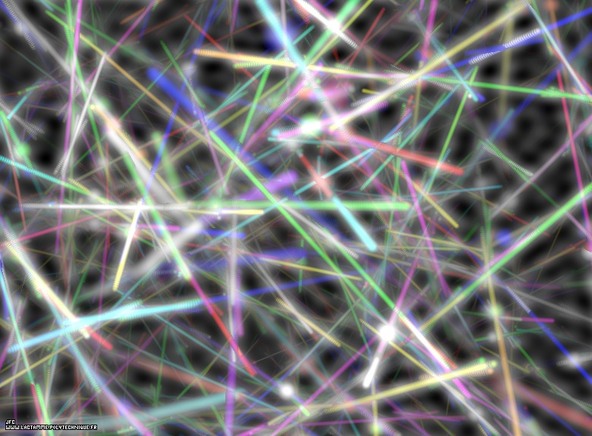
Quantum vacuum fluctuations
The quantum vacuum is not empty. Everywhere and constantly sets of particles are created and anihilated (for example pairs of electron-positron). This picture displays this phenomenon during a very short duration.
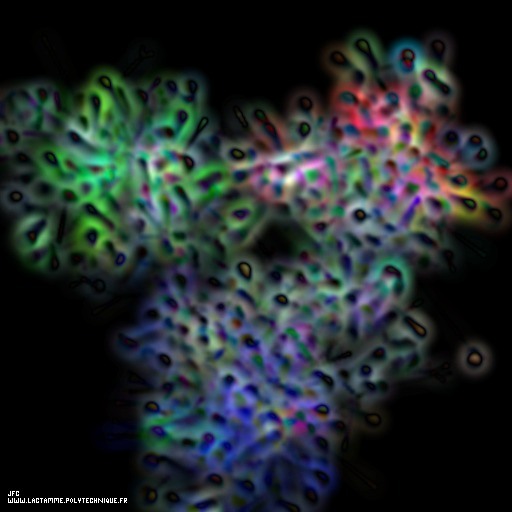
Quark and gluon structure of a nucleon
A nucleon (a proton or a neutron) is not an elementary “object” : it is composed of quarks (the small spheres) and gluons that are the vectors of the strong interaction. The “volume” of the nucleon is full of virtual particles that interact constantly with each others.
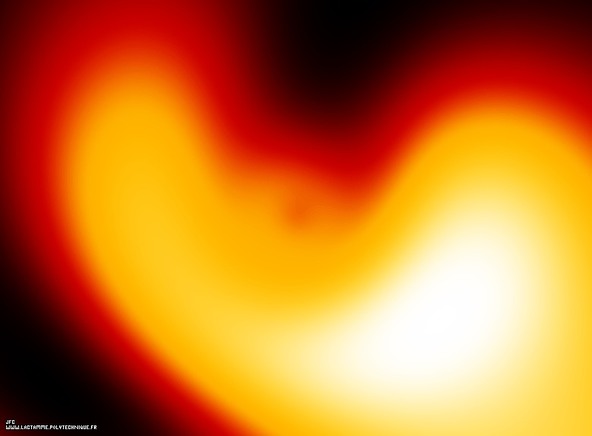
The Hydrogen atom
Tridimensional display of a linear superposition of 6 eigenstates of the Hydrogen atom.
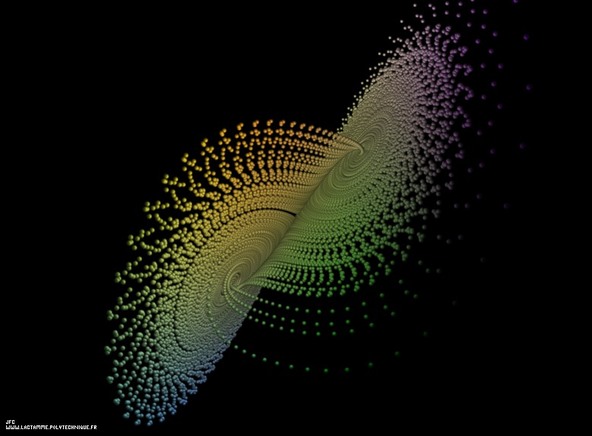
The Lorenz attractor
The Lorenz attractor is defined with the following system of non linear differential equations :
dx/dt=-10x + 10y
dy/dt=28x - y - xz
dz/dt=-8z/3 + xy
This picture is obtained integrating these equations using the Runge-Kutta method of the fourth order.
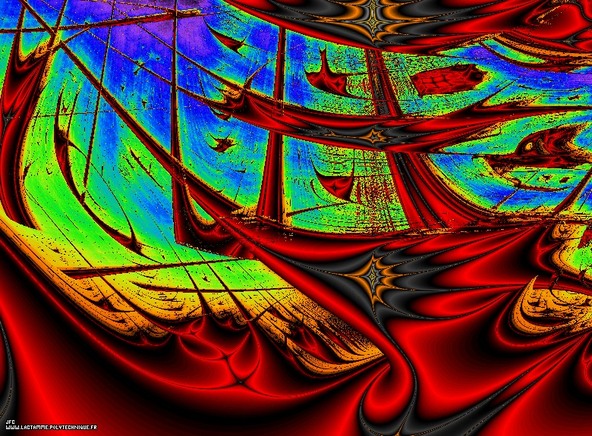
Bidimensional visualization of the Verhulst dynamics
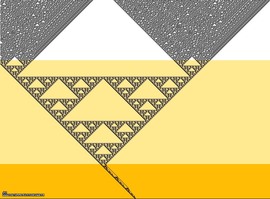
The Verhulst dynamics is defined with the following iteration :
Xn+1=RXn(1-Xn)
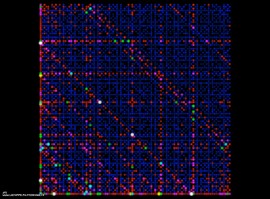
R being a parameter. For this picture R changes periodically using 2 values R1 and R2 displayed as the X and Y coordinates respectively. Grey, orange and red display negative Lyapunov exponents when yellow, green and blue display positive Lyapunov exponents (chaotic systems).
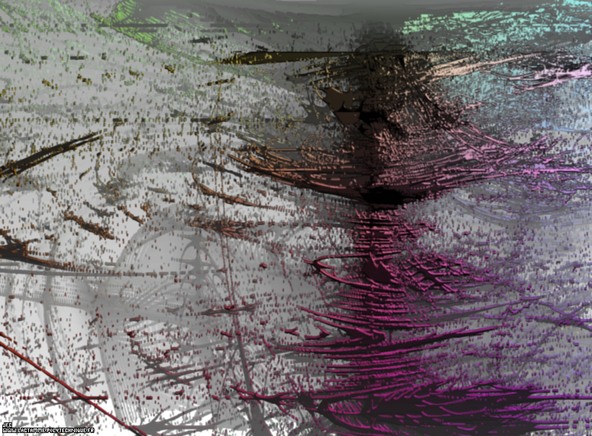
Tridimensional visualization of the Verhulst dynamics
The Verhulst dynamics is defined with the following iteration :
Xn+1=RXn(1-Xn)
R being a parameter. For this picture R changes periodically using 3 values R1, R2 and R3 displayed as the X, Y and Z coordinates respectively. The points display the non chaotic systems.
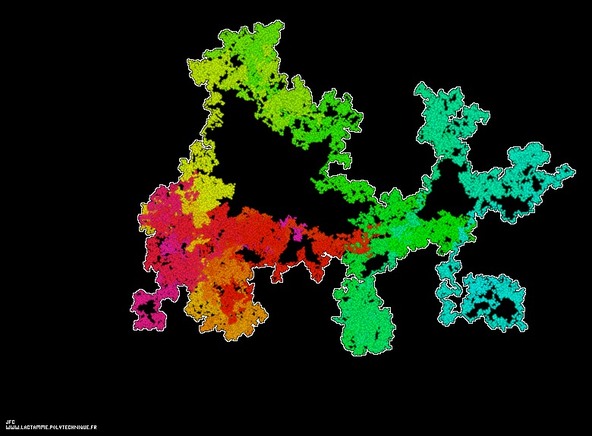
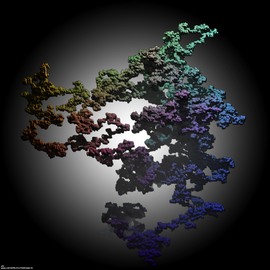
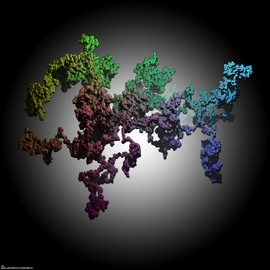
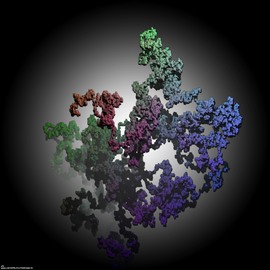
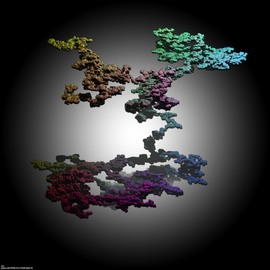
Tridimensional brownian motion
The colors used (magenta,red,yellow,green,cyan) are an increasing function of the time and the ‘external border’ of its bidimensional projection is displayed as a white curve.
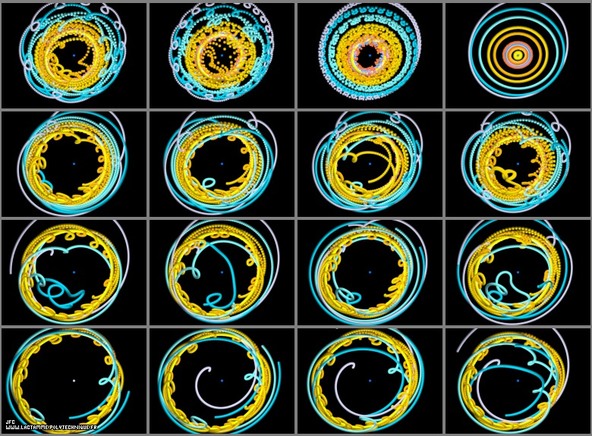
From the Sun to Pluto
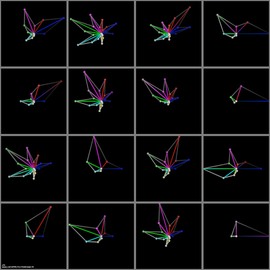
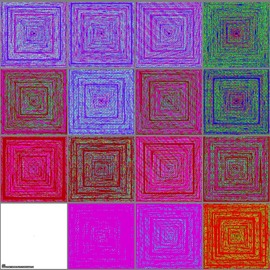
The upper right picture displays the heliocentric solar system (the Sun is a the center) when the lower left picture displays the point of view of Pluto (Pluto is a the center). The 14 remaining pictures display intermediate points of view (from the Sun to Pluto).
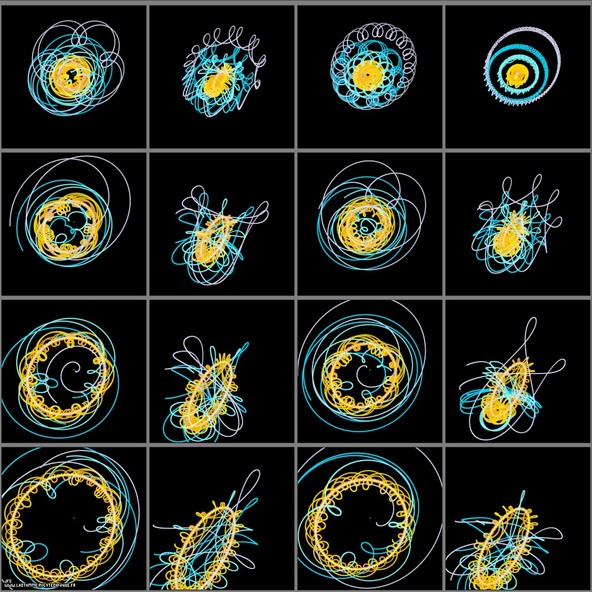
From the Sun to Pluto -extrapolation-
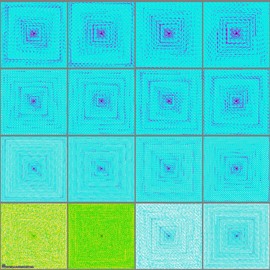
The heliocentric view of the solar system is very simple : the trajectories are close to perfect ellipses. The geocentric view of the solar system is a little more complicated and gives birth to the ptolemean epicycles. This pictures displays the points of view of 16 different celestial bodies more or less far from the Sun and whose trajectories are not in the ecliptic plane.

