Colorplot 2017
갤러리
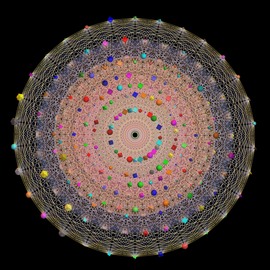
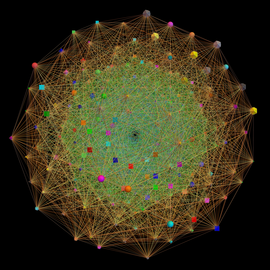
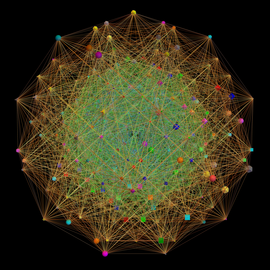
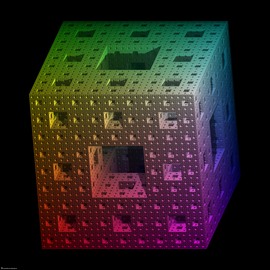
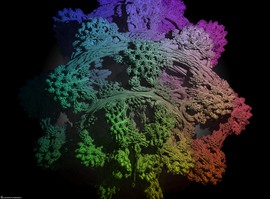
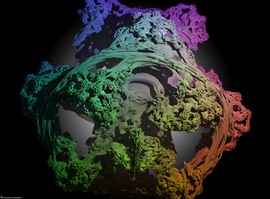
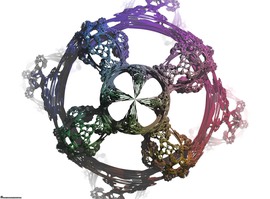
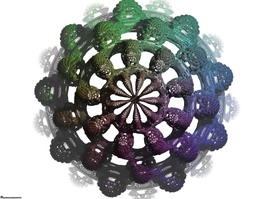
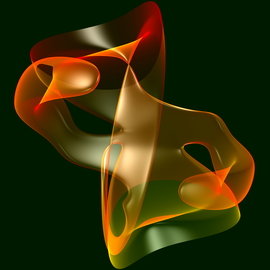
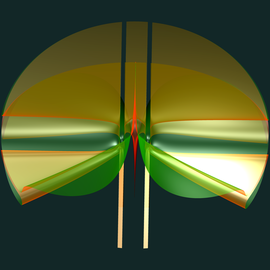
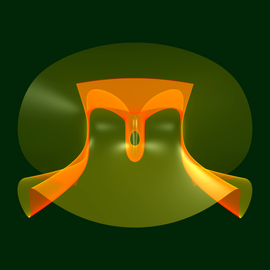
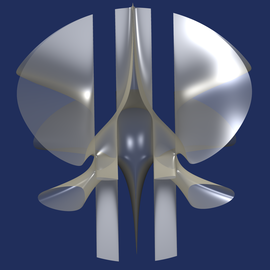
Colorplot 2017
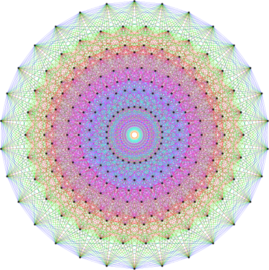
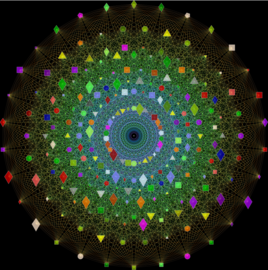
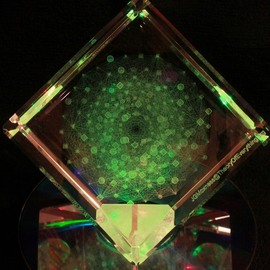
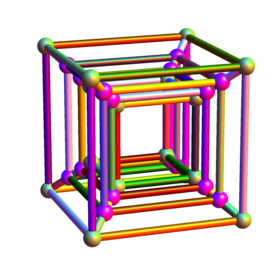
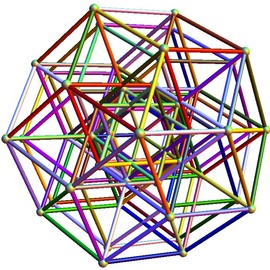
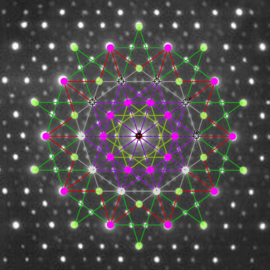
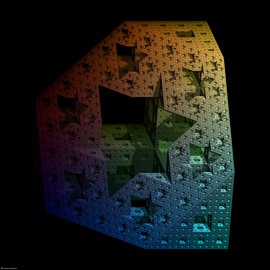
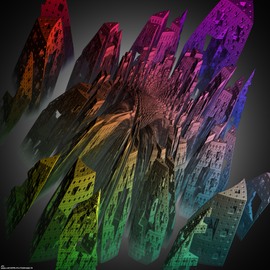
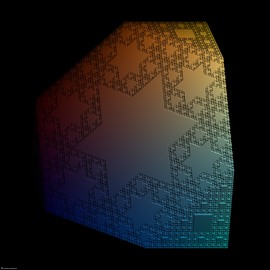
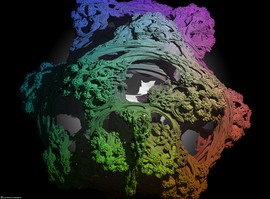
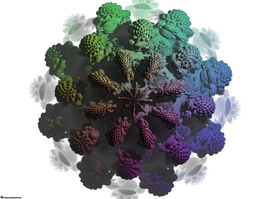
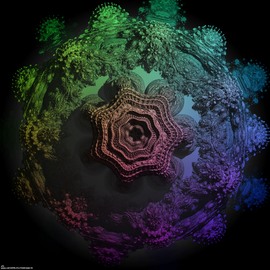
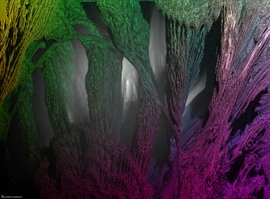
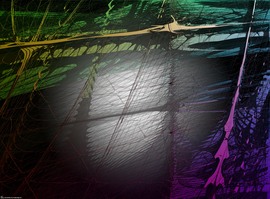
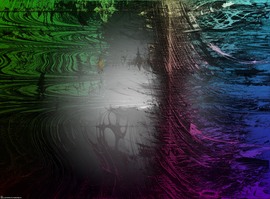
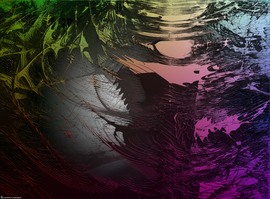
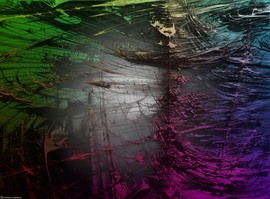
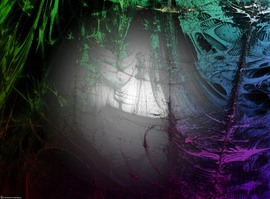
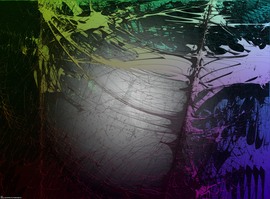
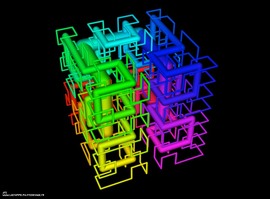
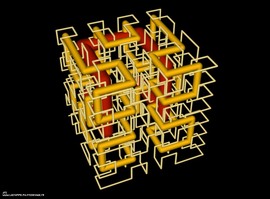
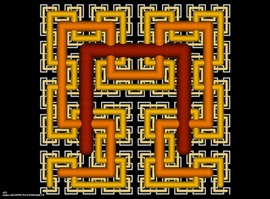
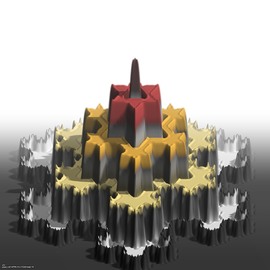
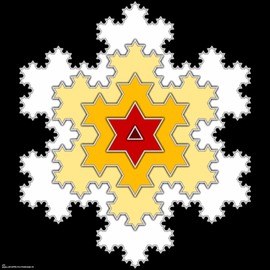
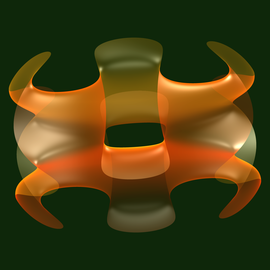
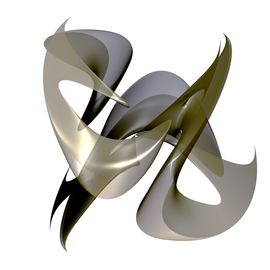
Colorplot is a feature of the geometric toolbox Cinderella 2. I have been working with this feature called Cindyscript for the past three years and have made hundreds of interesting images. It is a like a colorful etch-a-sketch. Here I experiment with writing for the x and y axis, and you can see the results.

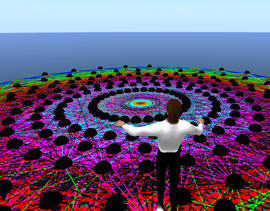
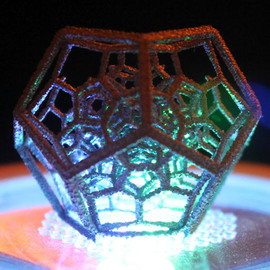
Light Show
저작권 CC BY-NC-SA-3.0