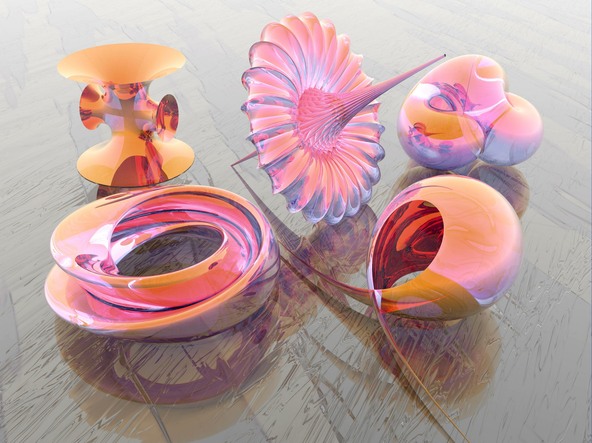
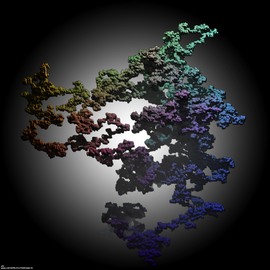
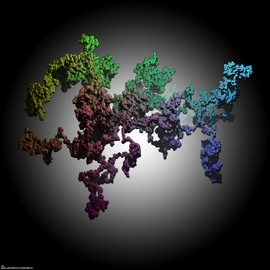
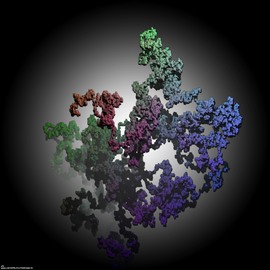
Richard Palais and Luc Benard
Mathematicians have used advances in the graphic arts to improve how they display mathematical concepts in their teaching and research going back to that ancient “upgrade” from drawing diagrams in sand to incising them in clay tablets. So it is no surprise that the paradigm changing modern technology of computers has provided spectacular new possibilities for visualizing ever more complex mathematical objects and processes. The authors of this gallery explore these objects, using among others 3D-XplorMath, a math visualization program designed to exploit fully this new technology. It is in effect a virtual math museum with an intuitive user interface that allows even non-mathematicians to take advantage of the new graphic possibilities to experience the visual beauty inherent in many different fields of mathematics.
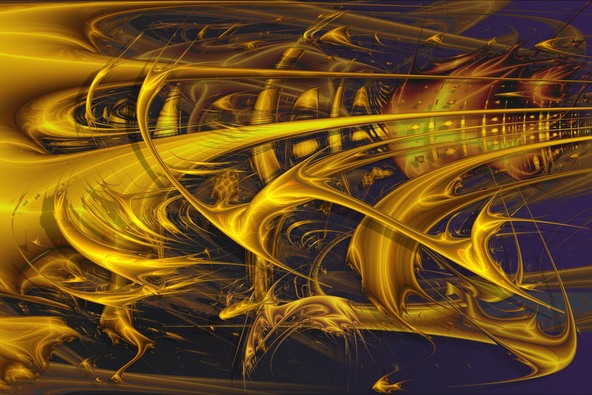
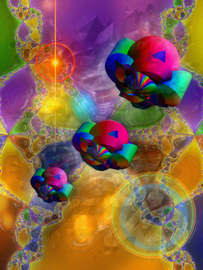
Lyapunov Play
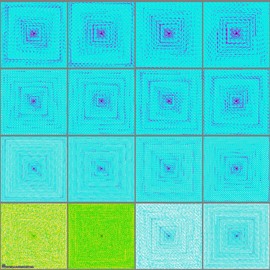
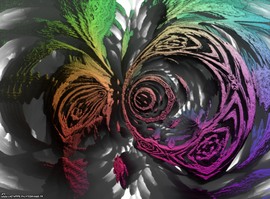
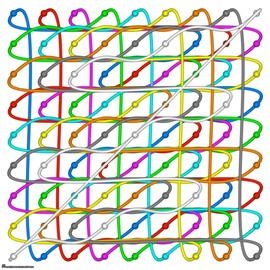
Mario Markus of the Max Planck Institute of Molecular Physiology has used dynamical systems to study the evolution of animal populations - the change over time of food, fertility, size, etc. - with dynamics requiring the ability of reproduction to alternate quasi-periodically between two values. Such systems can show both a stable cycle and chaotic evolution depending on the fertility ability. Stability or chaos can be analysed by computing the so-called Lyapunov exponent. (Lyapunov was a Russian mathematician living at the end of the 19th century)
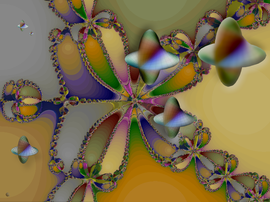
Markus-Lyapunov images are colour mappings of the Lyapunov exponent versus fertility, along horizontal and vertical axes. Only the stability domain is plotted; here, chaos (i. e. positive Lyapunov exponent) is rendered in dark blue. As the exponent goes from 0 to minus infinity, shades range from light to dark. At zero, the chaos threshold, the colour suddenly jumps from dark blue to a lighter shade. There is clearly much that is arbitrary in this colour mapping, and this gives an opportunity for choices based on aesthetic considerations. The picture consists of seven original Markus-Lyapunov pictures which were rebuilt and superimposed.
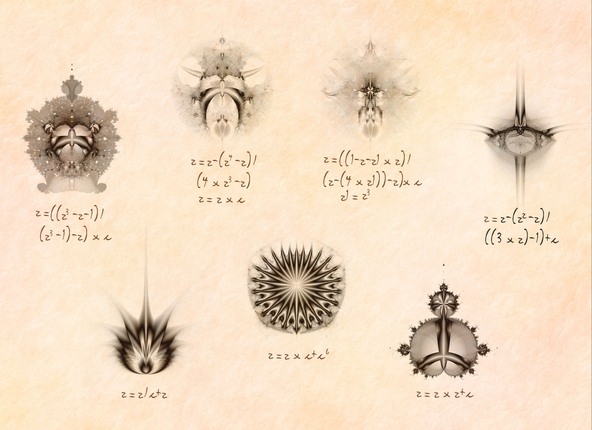
Equations Studies
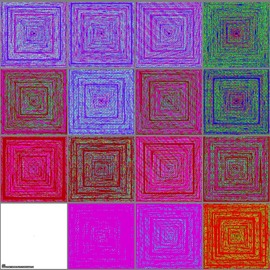
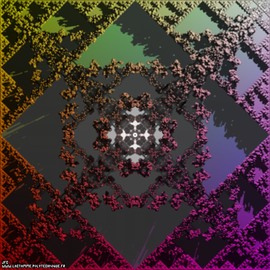
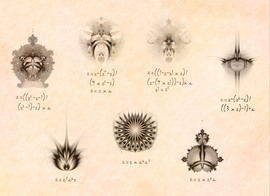
These fractal images were produced by using various equations as input in Stephen Ferguson’s Flarium24 Windows program, us- ing 40 Iterations and the filter:
rr+=atan(fabs(dzy/dzx))*atan(fabs(dzx/dzy))*2
They were then assembled in PhotoShop using fonts and coloration to mimic the old technical drawings of Leonardo DaVinci. While these images are highly mathematical in origin, many people find them aesthetically appealing completely independent of their source.
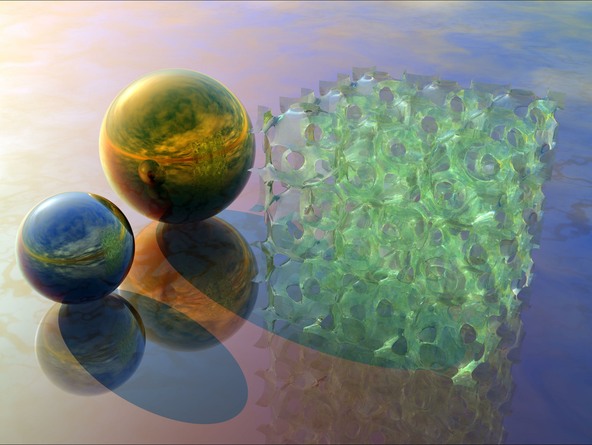
A Triply-Periodic Level Surface
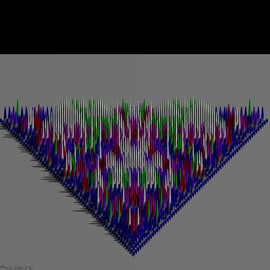
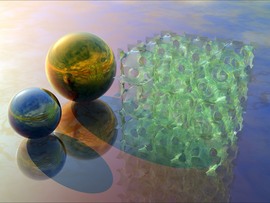
The green-tinted surface pictured here has three orthogonal translational symmetries. It is the level-surface given by the trigonometric equation:
4*(cos x*cos y+cos y*cos z+cos z*cos x) - 3*cos x *cos y *cos z = -2.4
A unit cell may be viewed as a central chamber with tubes to the corners and faces of the cube. This surface closely approximates the minimal P-Surface discovered in 1880 by Karl Hermann Amandus Schwartz (who was a Professor at Halle, Goettingen, and Berlin). Recently it has been investigated by material scientists, who use it and related surfaces to model so-called block- copolymers. The original model was taken from David A. Hoffman. This was textured, placed in a scene that we feel adds to the beauty of the object and rendered in Bryce.
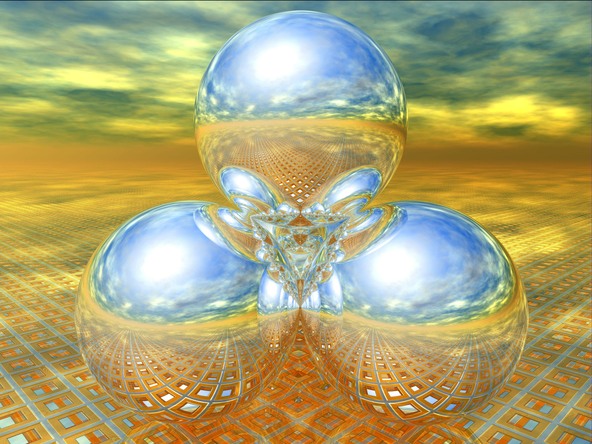
Wada Basins
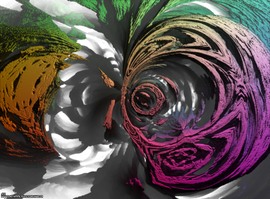
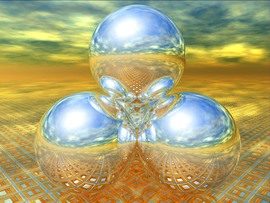
This is a rendering that replicates the results of experiments in chaotic scattering. The basic setup is four identical, highly reflective balls sitting in a pyramid formation so that each ball touches every other ball. If you look into the gaps between three balls, the reflected images you see make up a three dimensional fractal that has what is known as the Wada Property after the Japanese mathematician who studied such spatial divisions in 1917. The Wada Property refers to a discrete dynamical system having three basins of attractions that are so intertwined that every point on one basin boundary is also on the boundary of all other basins. The image was assembled and rendered in Bryce.

